Measured hydrodynamic intelligence your team can act on.
Full-field, experimentally anchored flow datasets so teams can choose configurations with confidence, shrink pilot scope, and validate CFD against reality.
How RPT-AI works
Understanding how fluids move inside industrial reactors is extremely difficult. Flows are three-dimensional, turbulent, and invisible — most industrial equipment is opaque. RPT-AI solves this by tracking a single tiny particle as it moves through the fluid, revealing how the entire flow behaves.
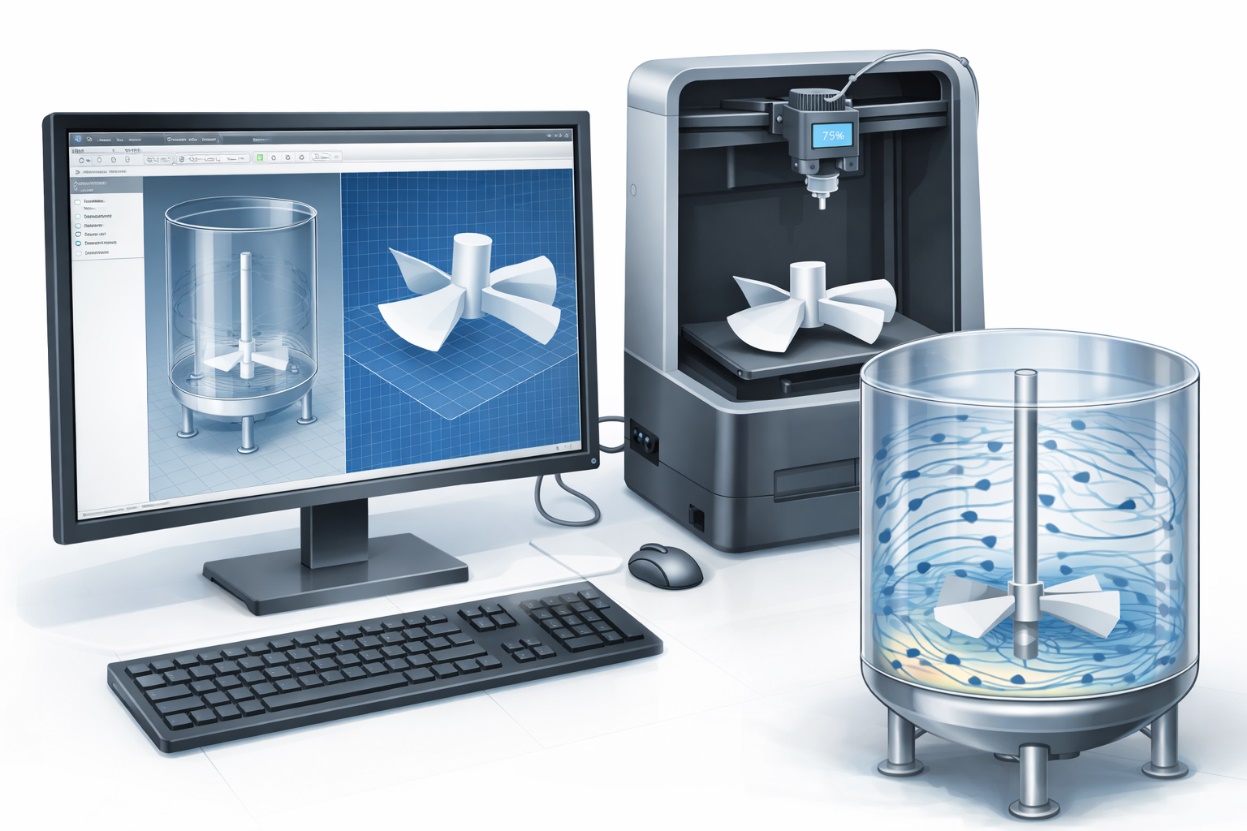
Build the experimental geometry
Using your CAD files, we 3D print the key elements of your reactor — vessel shell, inserts, baffles, and nozzles. You provide the fluid properties and operating conditions, which are integrated into the setup to replicate real system conditions.
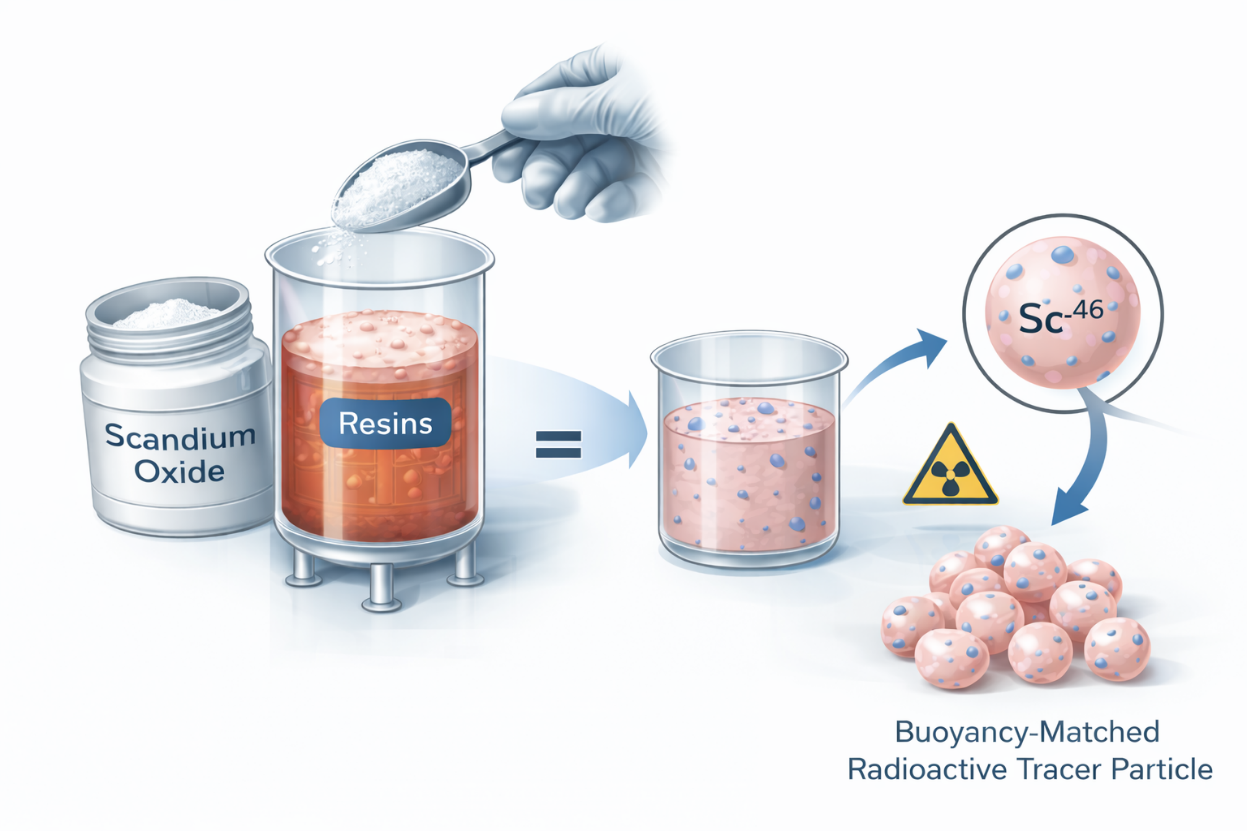
Track the motion of the fluid
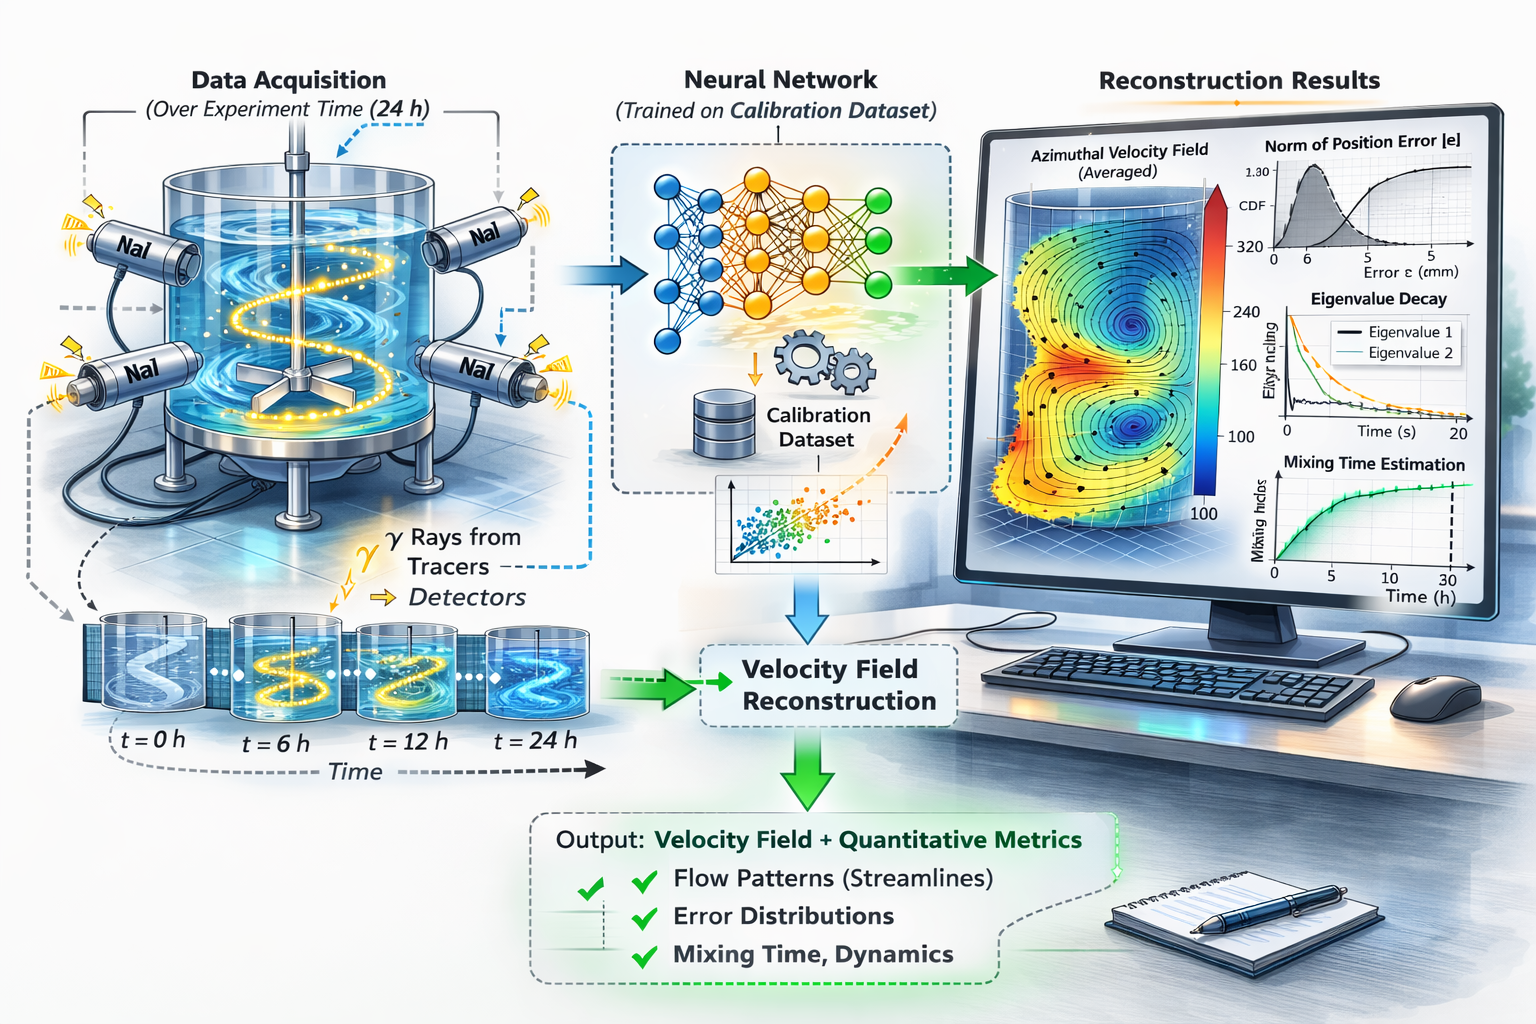
A tracer particle matched to the density of the phase being studied is activated in a nuclear reactor, making it emit gamma rays. Because gamma rays travel through metal and opaque materials, the particle is detected by scintillation detectors placed around the equipment — no optical access required.
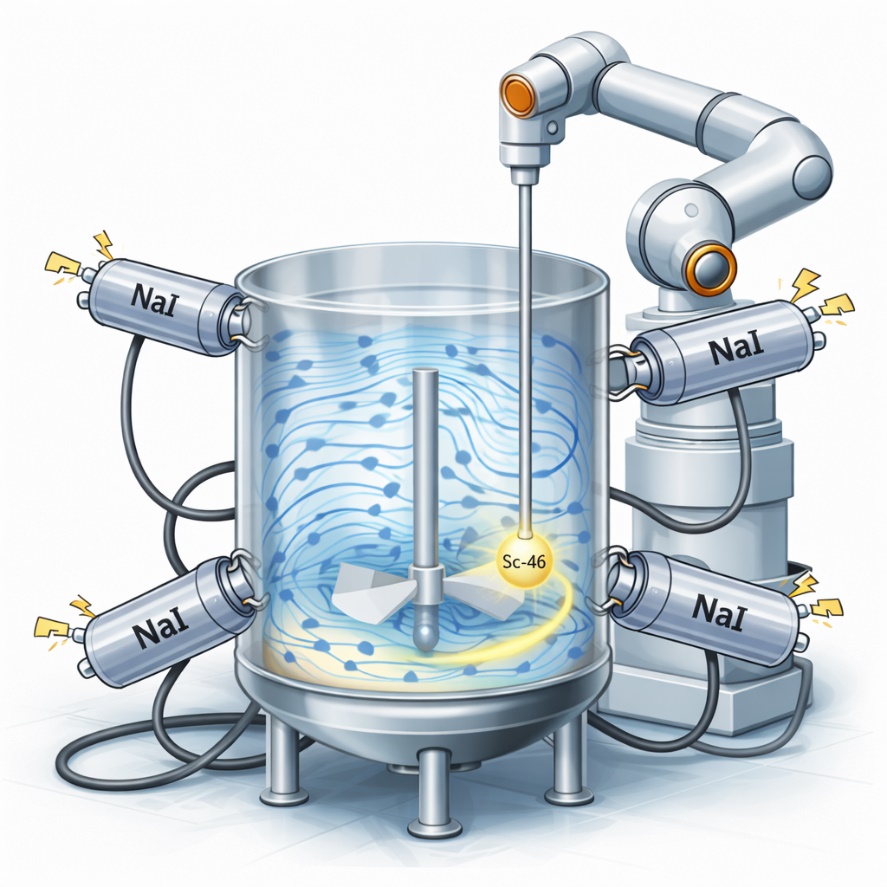
Robotic calibration for accurate positioning
A robotic arm called Handy moves the tracer throughout the entire reactor geometry. Millions of measurements at known positions train the reconstruction model. Validation measurements then quantify the precision and error distribution in three dimensions. This takes about two days.
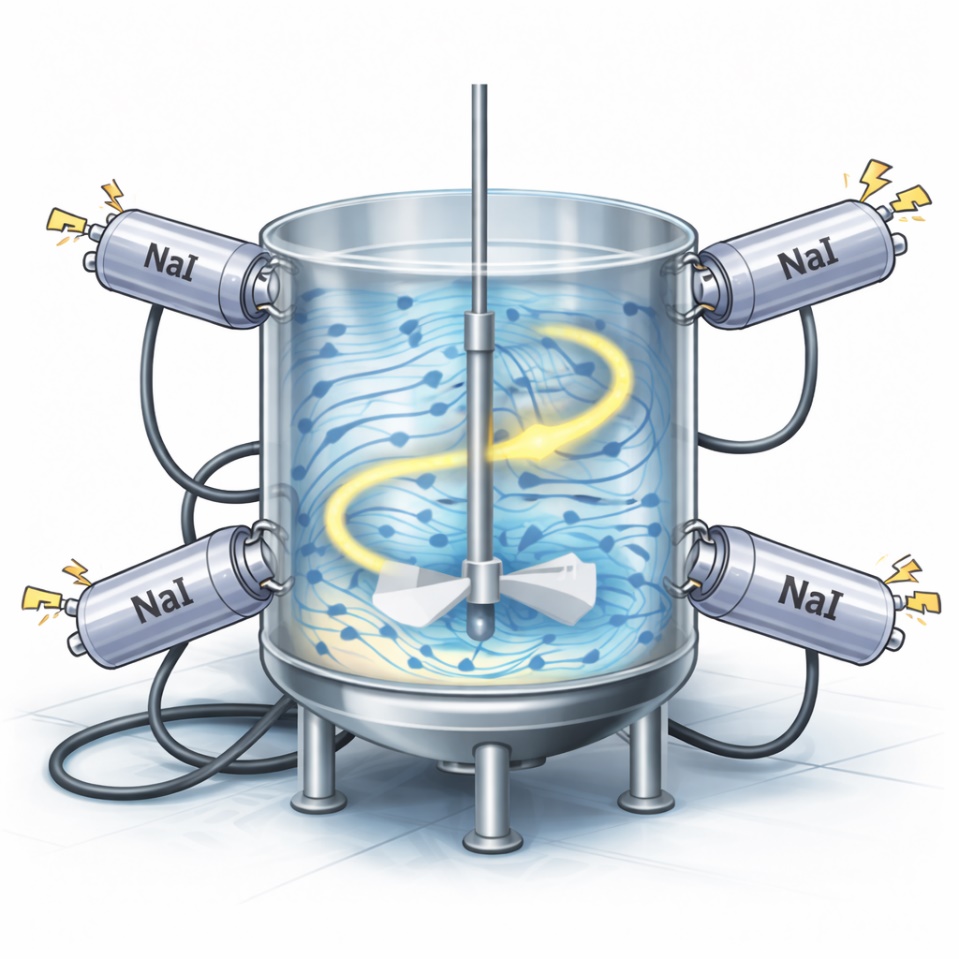
Measure the flow
The tracer moves freely inside the vessel for about 24 hours. Its position is recorded every 10 milliseconds, generating millions of data points that capture the true dynamics. If the geometry is unchanged, new experiments start immediately — up to 28 days of continuous experiments from a single calibration.
Get the data
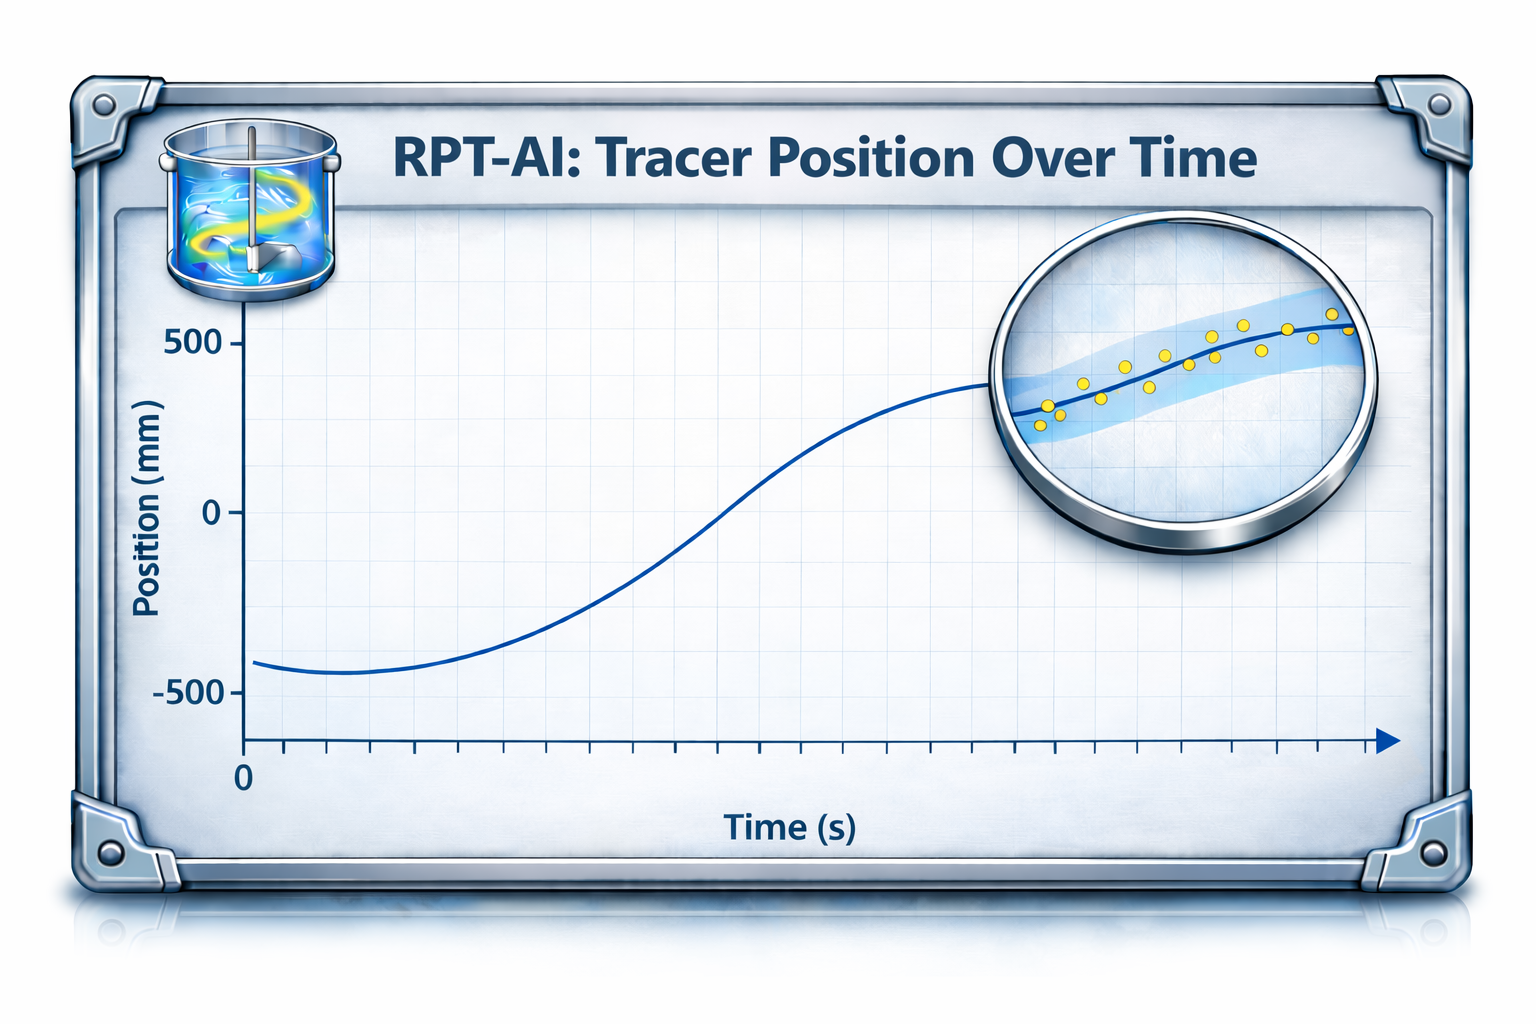
RPT-AI tracks the 3D position of a tracer particle every 10 milliseconds and reports the associated measurement uncertainty, generating a Lagrangian time series that describes the particle’s trajectory throughout the reactor during the experiment.
Analyze the data
From the reconstructed tracer trajectory, we provide an advanced analytics package to derive key hydrodynamic metrics such as Eulerian average velocity fields, pumping rates, mixing dynamics, and near-wall velocity distributions, providing quantitative insight into reactor performance.
Three pillars of measured intelligence
Measured physics first
Radioactive Particle Tracking provides real trajectory measurements. AI reconstructs full fields from measured data — no turbulence-model guessing.
We measure what others can only calculate.
Decision confidence
Compare configurations with quantified performance curves. Engineering decisions become evidence-based, not assumption-based.
Your CFD becomes trustworthy. Your pilot scope shrinks.
Data your team can use
Outputs delivered in standard engineering formats for integration into existing workflows. No proprietary lock-in.
Plug directly into your existing tools and processes.
Ready to see what's inside your reactor?
Book a 30-minute technical assessment and get a fixed-price proposal within 48 hours.
Book Technical Assessment